Real-Time Dashboard

With Rev, you have access to robust insights delivered with real-time analytics for live events and engagement analytics video-on-demand. Users can optimize return on their video investments during and after broadcasts by extracting trends and patterns about viewer experience and engagement.

ProBlem

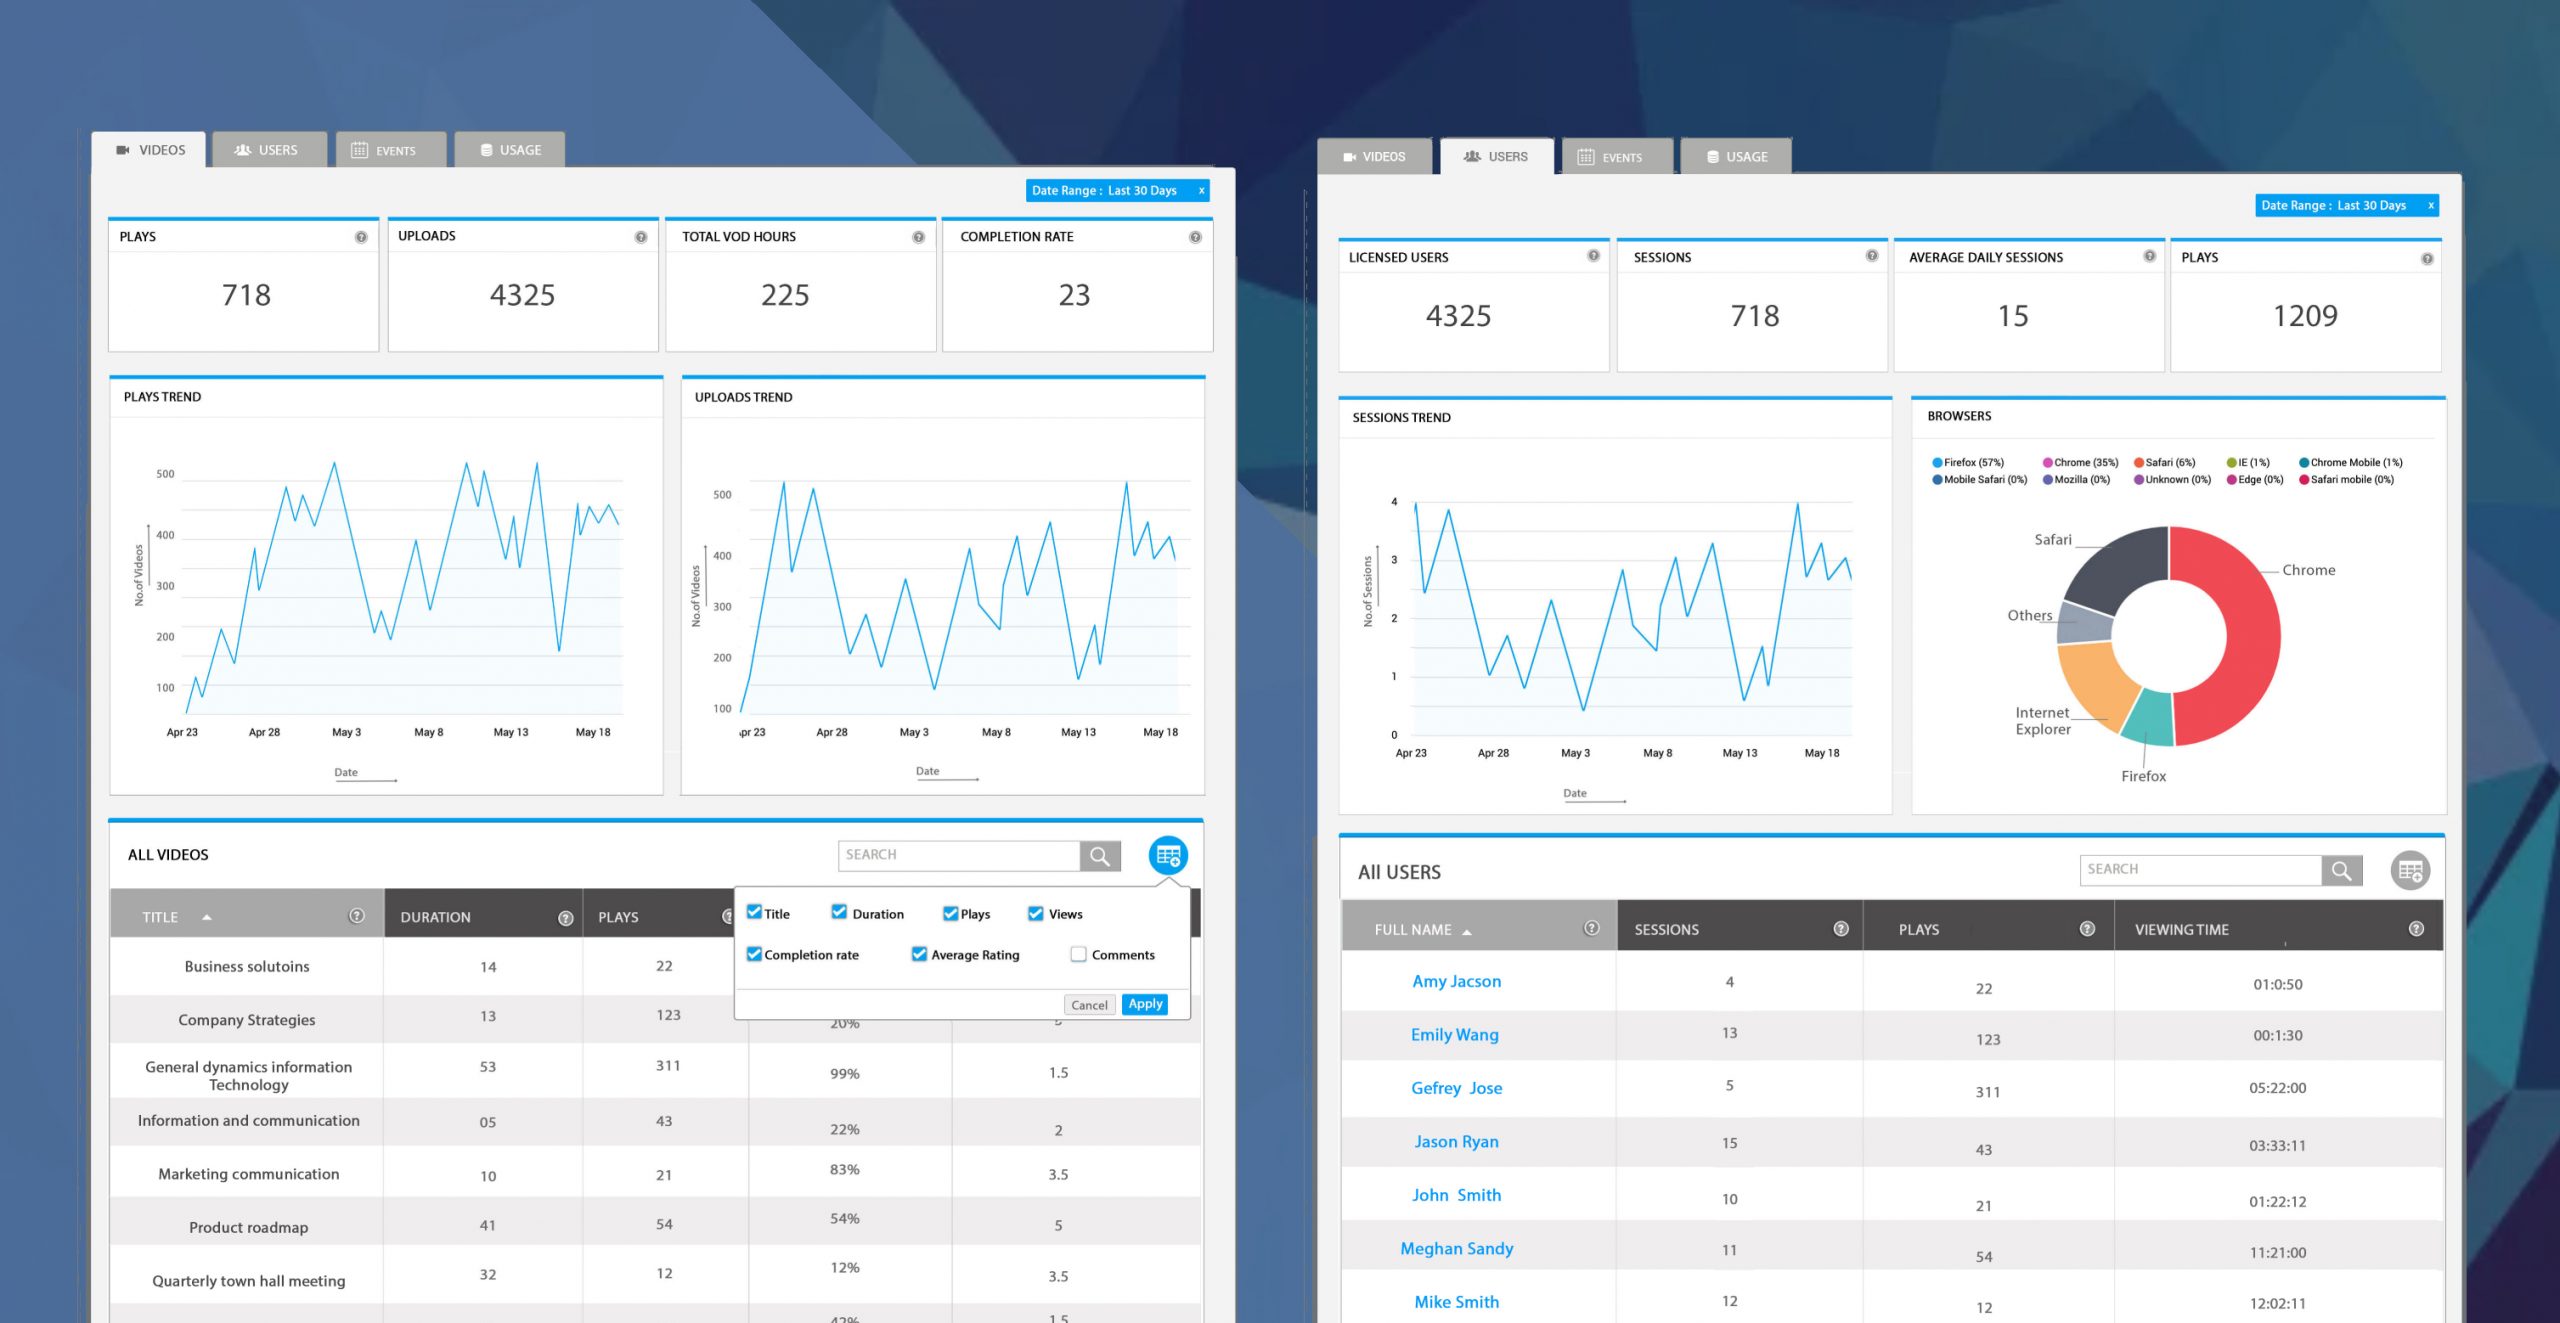
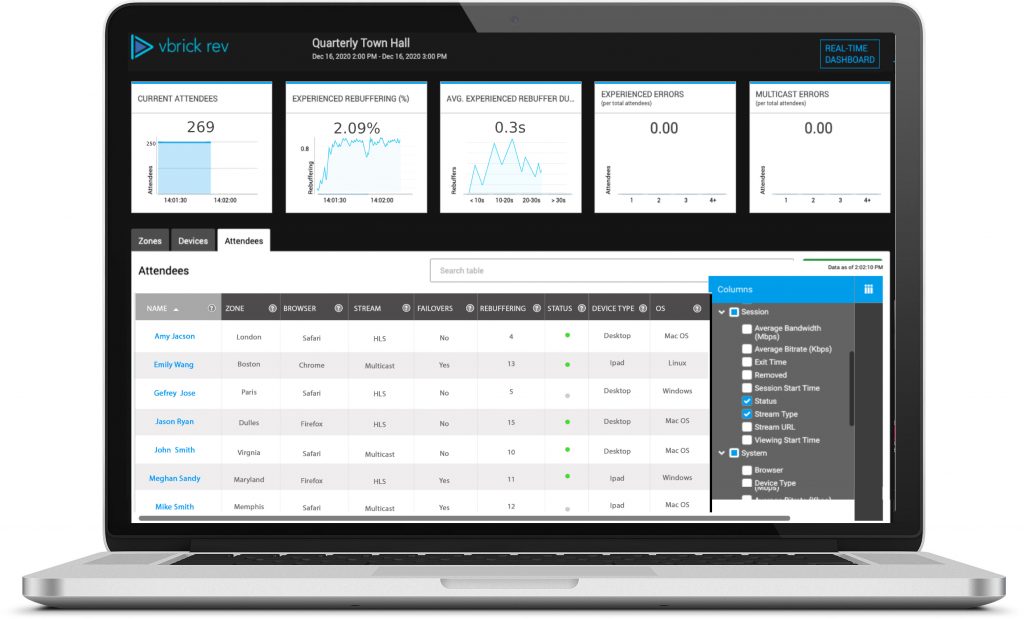
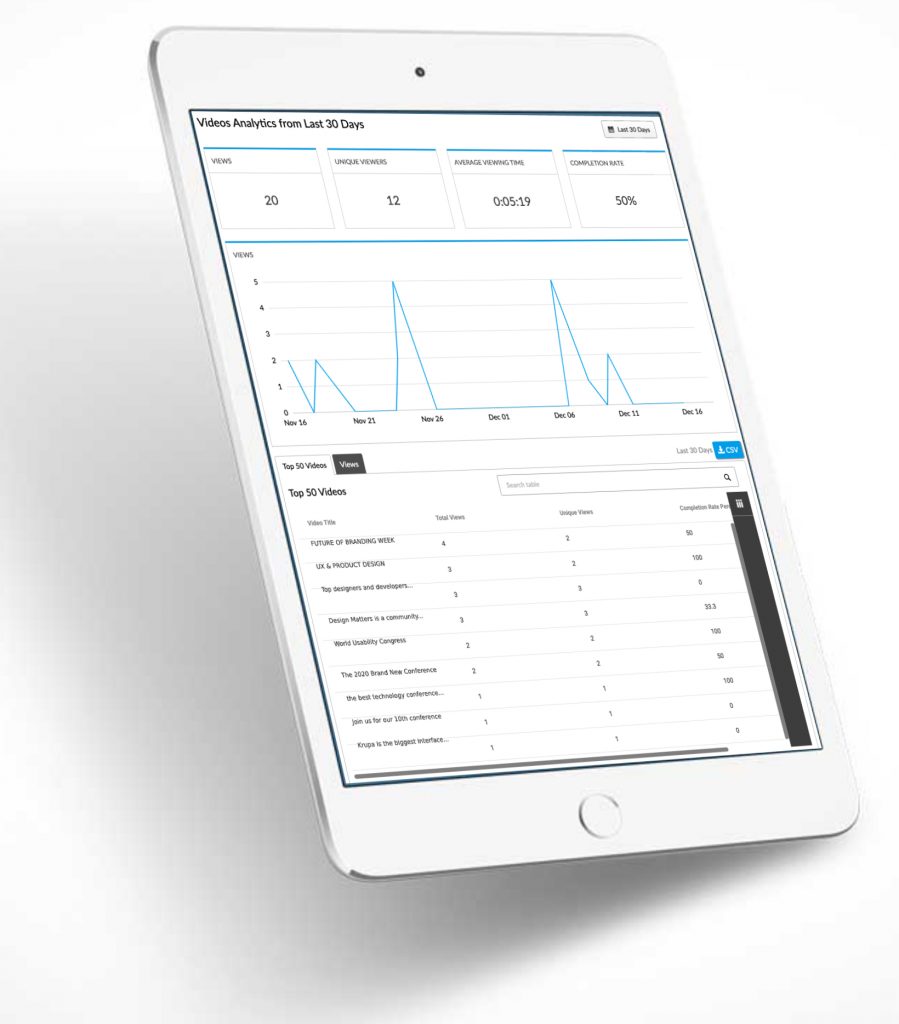
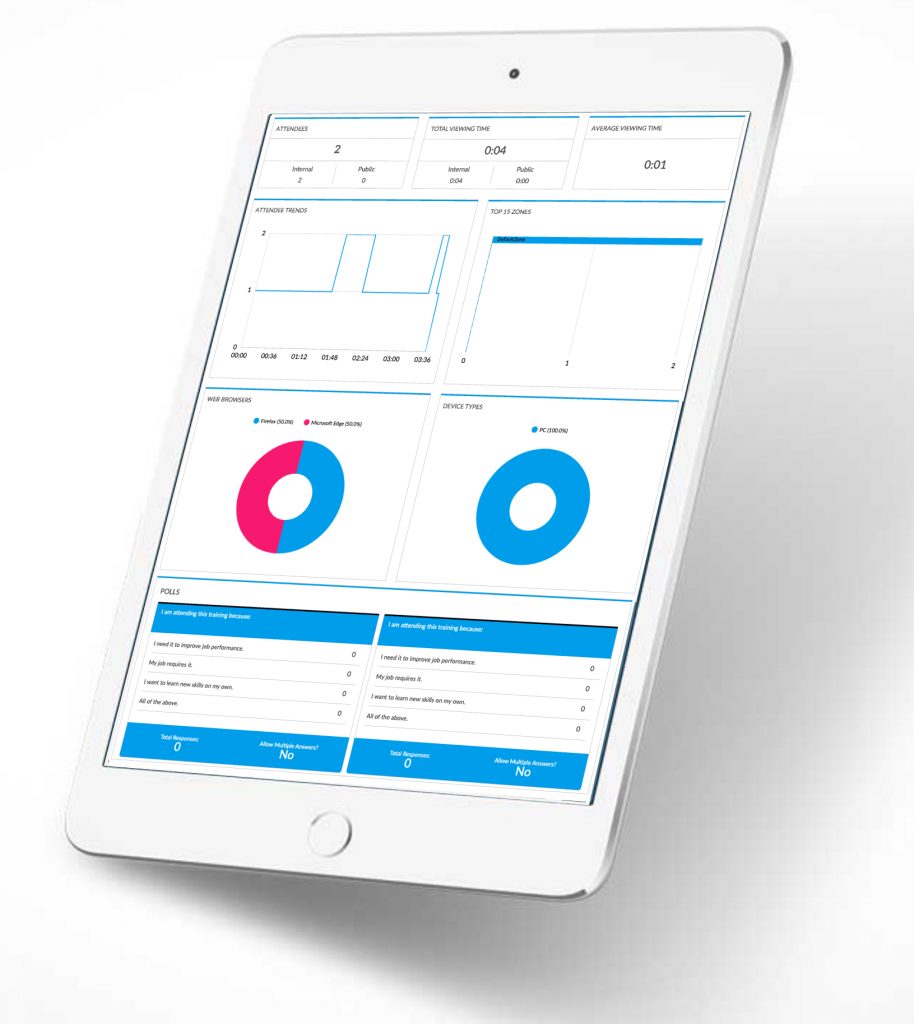
Video has become a mission critical component of the digital workplace as more companies leverage it for a multitude of use cases to enable improved communication and collaboration. As such, enterprises are delivering more live streaming video and developing more video-on-demand content than ever before. These enterprises require their video solutions to provide the intelligence necessary to maximize their return on investment and the integration capabilities necessary to expand and embed the power of video across processes and applications. Vbrick has recognized this need and continues to innovate in video analytics, integration and user experience.

Research

Conducted requirements-gathering interviews, designed and implemented user surveys; Facilitated card-sorting and tree-testing via Optimal Workshop.
Developed detailed test plans, test scripts, user flows, user personas, and training materials.
Conducted both quantitative and qualitative data analysis on data gathered from focus groups, one-on- one interviews, surveys, and remote and local user testing

Researched different type of Chat functionality based on:

  • Autoscaling
  • Timeline Filtering
  • Line Interpolation
  • Configurable Axis Labels
  • Legends (Labels & Gradient)
  • Advanced Label Positioning
  • Real-time data support
  • Advanced Tooltips
  • Data point Event Handlers
  • Theming

Participant observation

This is one of the effective and best research practice that I always do while interact with client/users. During the talk, i always observe what they are interest more about the features and which functionality they are repeating that motivate their users.

In-depth interviews

Prepare atelast 10 questions related to each topic before going to user interviews, some competititers features and  and also  sometimes ready immediately the idea with my pencil sketches. Always encourage users to describe their thoughts and feelings when they interact with the product.

A/B testing

Designing two different ideas by placing one LOGIN button can give idea that user think which one is better to make the process easy. I always ready with second design, some times user likes second as all the effort comes from the first will show on second design.

Card sorting

This is the key of final round, Yellow cards is the key role of my designs. This sorting rearranging the content/features after user interviews and testing makes my process more easy. Not only for me entire IT and Product team may understand the overall idea.


Responsiblities

Design Systems
Customer Journey
Mapping
User Interviews
Sketching
Wire-framing
Visual Design
Interactive Prototypin

Design & Development Tools

Paper & Pencil
marvel
InvisionApp
Adobe Photoshop
Adobe Illustrator
Adobe XD
HTML5
CSS3,Bootstrap
Java Script, JQuery

Testing

A/B Testing & Experiment  

Actively involve in testing tp match the app with my designs. 

Quick and easy fixes for any complicated problems.

Smart Recommendation.

Sketch

Design

Build your own dashboard

Sample Dashboad Anaytics

Live Webcast Analytics

Video Analytics

WebCast Analytics

Custom Dashboard Tool

Thanks for watching. Want to see more products case study…..

Find more unique interactive designs